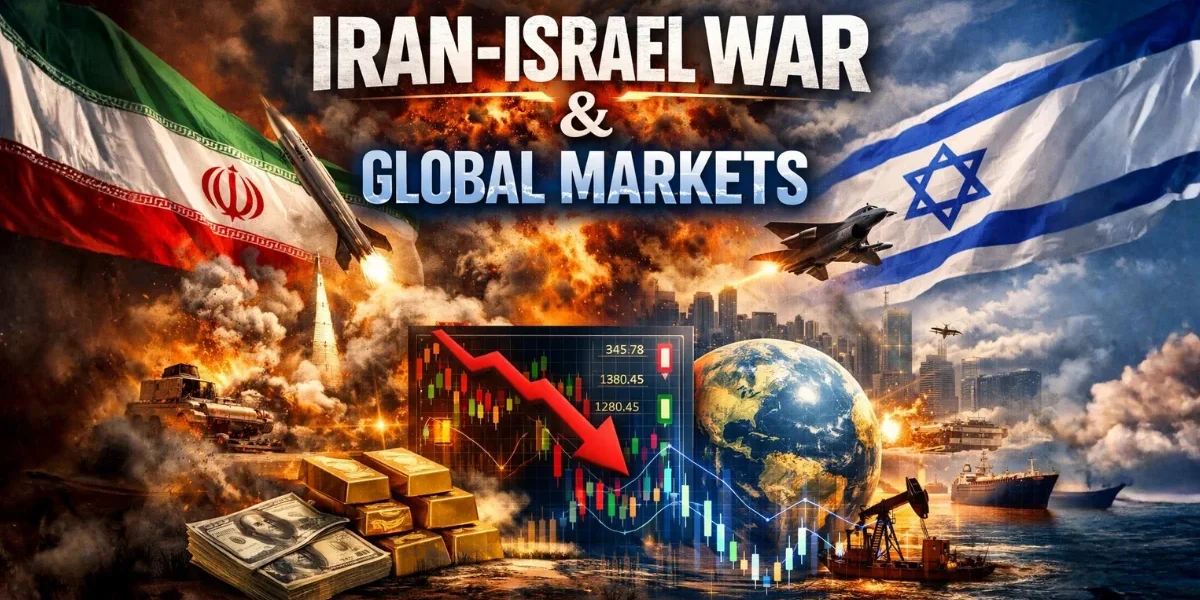
A New War Zone: What Is Happening Between Iran and Israel
The conflict between Iran and Israel has strengthened significantly since late 2023. Long-standing tensions, which had persisted for several decades, erupted into direct military confrontations by mid-2024.
Iran launched a series of drone and missile strikes on Israeli territory. Israel responded with targeted air operations inside Iranian borders. The United States positioned naval assets in the region, signaling deep geopolitical involvement.
This is no longer a proxy conflict. It is a direct confrontation between two regional powers.
Financial markets reacted almost immediately.
Geopolitical conflicts historically trigger short-term volatility. The Iran-Israel war is creating sustained uncertainty across energy, equities, and currency markets.
Understanding how this conflict affects your investments is not optional. It is essential.
Global Stock Markets Enter Risk-Off Mode: The Immediate Financial Fallout
When the conflict escalated, global equity markets moved swiftly into risk-off territory. Investors sold equities and moved capital into safer assets.
S&P 500 Vulnerability: Analysts at Goldman Sachs and JPMorgan warned that a prolonged conflict could push the S&P 500 into a 10% correction. Geopolitical risk premiums climbed across all major indexes.
European markets showed even sharper reactions. The EURO STOXX 50 fell by over 2% in a single session following major escalation events. Export-dependent Asian markets, including Japan’s Nikkei 225, also shed value rapidly.
Market Reactions at a Glance
| Index | Immediate Reaction | Catalyst |
| S&P 500 (US) | -1.8% in 48 hours | Geopolitical risk premium |
| Nasdaq 100 | -2.3% in 48 hours | Tech sell-off, risk aversion |
| EURO STOXX 50 | -2.1% in a single session | Energy dependency fears |
| Nikkei 225 (Japan) | -1.6% over 3 days | Export and oil import concerns |
| MSCI Emerging Markets | -2.7% over one week | Capital flight to safety |
Source: Bloomberg Terminal, Reuters Markets Data, 2024.
The pattern corresponds with times of conflict in the past. Within weeks of Iraq’s invasion of Kuwait during the 1990 Gulf War, the S&P 500 fell 16% before rising again. According to historical data, short wars typically result in short-term declines, whereas long-term conflicts cause long-term harm.
Oil Above $100: How Middle East War Is Shocking the Energy Market
The Middle East is home to roughly 33% of the world’s proven oil reserves. Any conflict in this region raises immediate concerns about supply troubles.
Oil prices surged past $100 per barrel following direct military exchanges. Brent Crude, the global benchmark, crossed this threshold for the first time since the 2022 Russia-Ukraine energy crisis.
The Strait of Hormuz: The World’s Most Critical Chokepoint
Around 20% of all globally traded oil passes through the Strait of Hormuz daily, making it a critical chokepoint according to the International Energy Agency’s World Energy Outlook 2024.
This narrow waterway, just 33 kilometers at its narrowest point, sits between Iran and Oman.
If Iran were to block or mine the Strait, daily global oil flow would drop by nearly 21 million barrels. The International Energy Agency (IEA) has warned that this scenario could send Brent Crude above $150 per barrel.
Even the threat of Strait of Hormuz closure without an actual blockade adds a $10–$20 risk premium per barrel. This war is already doing exactly that.
Oil Price Scenarios Based on Conflict Duration
| Conflict Scenario | Estimated Brent Crude Price | Global Impact |
| Quick ceasefire (< 30 days) | $85 – $95 per barrel | Short-term spike, quick recovery |
| Prolonged regional war (3–6 months) | $100 – $120 per barrel | Sustained inflation, growth slowdown |
| Strait of Hormuz closure | $140 – $160+ per barrel | Global recession risk |
Source: IEA World Energy Outlook, Bloomberg Commodities Desk.
War, Oil, and Inflation: How Rising Energy Costs Hit Every Household
Oil is embedded in the global economy at every level. When prices spike, the effects ripple across transportation, manufacturing, food, and consumer goods.
Research indicates that a 10% sustained rise in oil prices increases global inflation by approximately 0.4 percentage points, as detailed in the IMF’s World Economic Outlook. It simultaneously reduces global GDP growth by 0.2–0.3 percentage points.
- Transportation and logistics costs climb, increasing prices of virtually all traded goods.
- Petrochemical inputs rise, raising costs in plastics, fertilizers, and pharmaceuticals.
- Food inflation accelerates as farming, processing, and distribution all depend on fuel.
- Central banks face a dilemma: raise rates to fight inflation and risk recession, or hold rates and let inflation run.
The US Federal Reserve and European Central Bank are both watching the Middle East closely. A sustained oil shock could force rate decisions that further slow already fragile economies.
Gold, the Dollar, and Bitcoin: Where Smart Money Is Moving
During crises, investors flock to safe assets: gold, the US dollar, and increasingly, Bitcoin.
Gold: The Timeless Crisis Hedge
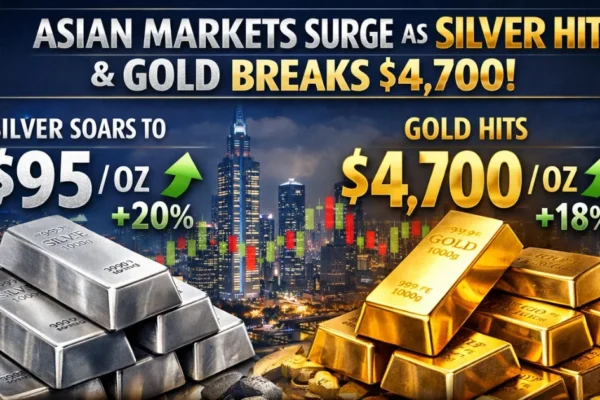
Gold rose above $2,400 per ounce amid intensified conflict, reflecting patterns seen in previous market shocks, such as in Asian markets reacting sharply as silver and gold surged.
This situation is similar to the 2022 trend, when Russia invaded Ukraine, causing gold to surge 8% in just two weeks. The World Gold Council reports that central banks worldwide increased their gold reserves by more than 1,000 tons in 2023.
The US Dollar: Strength in Uncertainty
The US Dollar Index (DXY) rose by more than 1.5% following significant escalation events. The dollar continues to be the world’s reserve currency, benefiting from global risk aversion. Furthermore, higher oil prices indirectly support the dollar because oil is priced globally in USD.
Bitcoin as Geopolitical Hedge: Still Being Tested
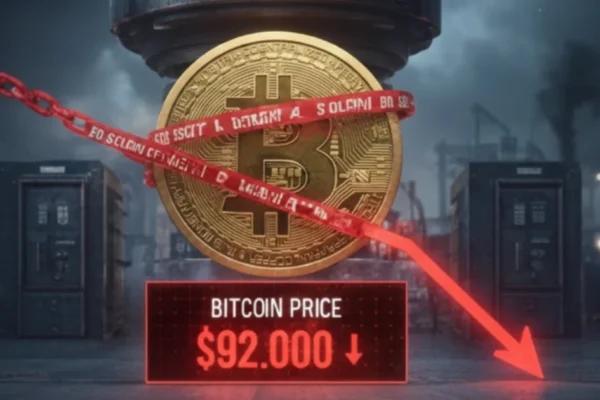
Bitcoin initially rose by 6% during peak conflict news cycles, reinforcing the digital gold narrative, though it remains volatile, as shown when Bitcoin fell sharply amid tariff and market fears. However, because Bitcoin’s performance is correlated with risk assets, it may experience sharp declines if the broader equity markets crash.
In the early stages of a crisis, Bitcoin acts as a partial safe haven; however, during extended market downturns, it may behave more like a risk asset. This is not insured, but it functions as a hedge.
| Asset | Performance During Conflict Spike | Historical Pattern |
| Gold (XAU/USD) | +5.8% in 2 weeks | Strong safe haven in all major conflicts |
| US Dollar (DXY) | +1.5% in 1 week | Consistent strength in risk-off cycles |
| Bitcoin (BTC) | +6.1% initial, then volatile | Emerging hedge, inconsistent long-term |
| US Treasuries (10Y) | Yields fell to 4.1% | Classic flight-to-safety behavior |
Source: World Gold Council, CoinMarketCap, Bloomberg, 2024.
Winners and Losers: Tracking Where the Money Is Moving
It’s important to recognize that different sectors are affected in various ways during geopolitical conflicts. Knowing who benefits and who doesn’t can really help with making smarter choices for your portfolio.
Sectors That Benefit
- Energy Companies: ExxonMobil, Chevron, and BP experienced an increase of 8–14% in the weeks after oil prices surged.
- Defense and Aerospace: Lockheed Martin, Raytheon, and Northrop Grumman experienced stock price increases of 10–18% subsequent to escalations in conflict.
- Gold Miners: Barrick Gold and Newmont Corp. increased by 12–15% following a surge in gold prices.
Sectors Under Pressure
- Airlines: Global airline stocks dropped 10–15% due to fuel cost concerns and possible air-route disruptions.
- Tourism and Hospitality: Regional and international tourism declined sharply, impacting hotel and travel stocks.
- Technology: High-valuation tech stocks fell as risk-off sentiment reduced appetite for growth investments.
- Manufacturing: Supply chain disruptions and rising input costs squeezed margins across the sector.
Broken Supply Chains: How War Disrupts Global Trade Flows
Modern supply chains depend on reliable, predictable shipping routes. The Middle East conflict has disrupted key logistics corridors, particularly in the Red Sea and surrounding waterways.
Shipping insurance premiums for vessels transiting the region increased by 200–400% according to Lloyd’s of London data.
How Does the Iran–Israel Conflict Affect Trade?
The ongoing conflict has caused major disruptions in global shipping:
- Leading carriers like Maersk and Hapag-Lloyd rerouted vessels around the Cape of Good Hope, adding 10–14 extra days to transit times.
- Container freight rates from Asia to Europe jumped 30–60% within weeks, increasing shipping costs.
- European ports experienced severe congestion as delayed ships arrived simultaneously.
- Just-in-time manufacturing faced immediate challenges due to late deliveries, putting supply chains under pressure.
These delays highlight how geopolitical crises can increase costs, disrupt trade, and impact manufacturing globally.
The World Trade Organization (WTO) estimated that sustained Middle East shipping disruptions could reduce global trade volume by 1.5–2% annually.
Investor Action Plan: How to Protect Your Portfolio During Geopolitical Crises
During market disruption, staying calm and following a clear plan is key. Here’s a step-by-step approach for investors of all levels:
- Diversify Your Investments
Spread your money across stocks, bonds, commodities, and cash. No single type of investment can protect you from all risks.
Add Commodity Exposure
Consider allocating 5–10% of your portfolio to gold, oil ETFs, or commodity funds. These assets can act as a hedge against rising energy prices. - Focus on Defensive Stocks
Sectors like utilities, healthcare, and consumer staples often perform better when markets are volatile. - Avoid Panic Selling
Studies by Vanguard show that investors who sell during crises and miss the 10 best recovery days can lose up to 50% of long-term returns. Staying invested matters. - Check Your Currency Exposure
If you have international investments, holding some US dollars can help protect your portfolio against currency fluctuations. - Stay liquid
Maintain 10–15% cash reserves during high-uncertainty periods. This allows opportunistic buying during sharp dips.
Long-term investors who held through the Gulf War (1990), 9/11 (2001), and the 2022 Russia-Ukraine conflict all recovered and outperformed panic sellers within 12–18 months.
3 Scenarios for the Iran-Israel Conflict and Their Market Consequences
Markets price in probabilities. Understanding how different conflict outcomes affect your portfolio helps you position ahead of the curve.
| Scenario | Timeline | Oil Price Impact | Market Impact | Investor Action |
| Quick ceasefire | < 30 days | $85–95/barrel | V-shaped market recovery | Stay invested and reduce hedges |
| Prolonged regional war | 3–12 months | $100–120/barrel | Slow grind lower, high volatility | Hold energy stocks, reduce tech |
| Full regional escalation | 12+ months | $140–160+/barrel | Global recession, broad sell-off | Maximum defensive positioning |
Source: Finance Curves analysis based on IMF, IEA, and Bloomberg scenario modeling.
War Creates Risk, But Prepared Investors Find Opportunity
The Iran-Israel war has introduced a new layer of financial uncertainty into an already complex global economy. Energy markets carry the highest immediate risk. Inflation pressures are building. Supply chains are stressed.
History shows that markets can recover even after major shocks. Investors who understand the risks, diversify wisely, and stay calm usually perform better than those who panic. The key is to make smart choices, even in uncertain times.
Right now, investors focus on high-quality defensive stocks, commodities to protect against energy-driven inflation, and keeping cash ready to invest when markets dip.
This conflict will eventually end, and markets will adjust. The investors who succeed are the ones who build strong, flexible portfolios before the recovery, not after.
Geopolitical events move fast. Your financial knowledge must move faster. FinanceCurves provides clear, data-based market analysis, investment strategies, and timely insights for investors who don’t want to be caught off guard.
FAQs
What impact does the Iran-Israel conflict have on global oil prices?
The conflict threatens oil supply routes in the Middle East, which controls 33% of global reserves. Oil prices have surged past $100 per barrel as markets price in supply disruption risk. If the Strait of Hormuz is blocked, prices could exceed $150 per barrel.
Can Bitcoin serve as a hedge during geopolitical crises?
Bitcoin behaves like digital gold, attracting risk-off capital, but remains volatile and should complement diversified portfolios.
Which sectors gain from Middle East conflicts?
Energy, defense, and gold mining sectors benefit, while airlines, tourism, and manufacturing typically underperform.
How does this conflict affect global inflation?
Rising oil prices increase transportation, manufacturing, and food costs, adding pressure to consumer prices worldwide.
What is the safest investment approach now?
Diversify assets, hedge with commodities, avoid panic selling, and monitor geopolitical developments.
Could global markets enter a correction due to the war?
Analysts warn that prolonged conflict could trigger a ~10% S&P 500 correction from heightened geopolitical risk.
How does shipping disruption affect trade?
Global supply chains and manufacturing are impacted by increased freight costs due to delays and increased insurance costs.
Risk Disclaimer & YMYL Notice
This article is for informational and educational purposes only. It does not constitute financial advice, investment advice, or a solicitation to buy or sell any financial instrument. Investing in financial markets involves significant risk, including the potential loss of principal. Past performance is not indicative of future results. Always conduct your own due diligence and consult a licensed financial advisor before making investment decisions. Finance Curves does not hold any liability for financial decisions made based on this content.

Marshall Mason, Senior Market Analyst at FinanceCurves.com, has over 9 years of experience covering financial markets, cryptocurrencies, and macroeconomic trends. He delivers data-driven insights, independent analysis, and actionable guidance for investors and traders. Marshall leverages authoritative sources, market data, and regulatory updates to help readers navigate volatility, adoption trends, and the evolving landscape of global finance and digital assets.