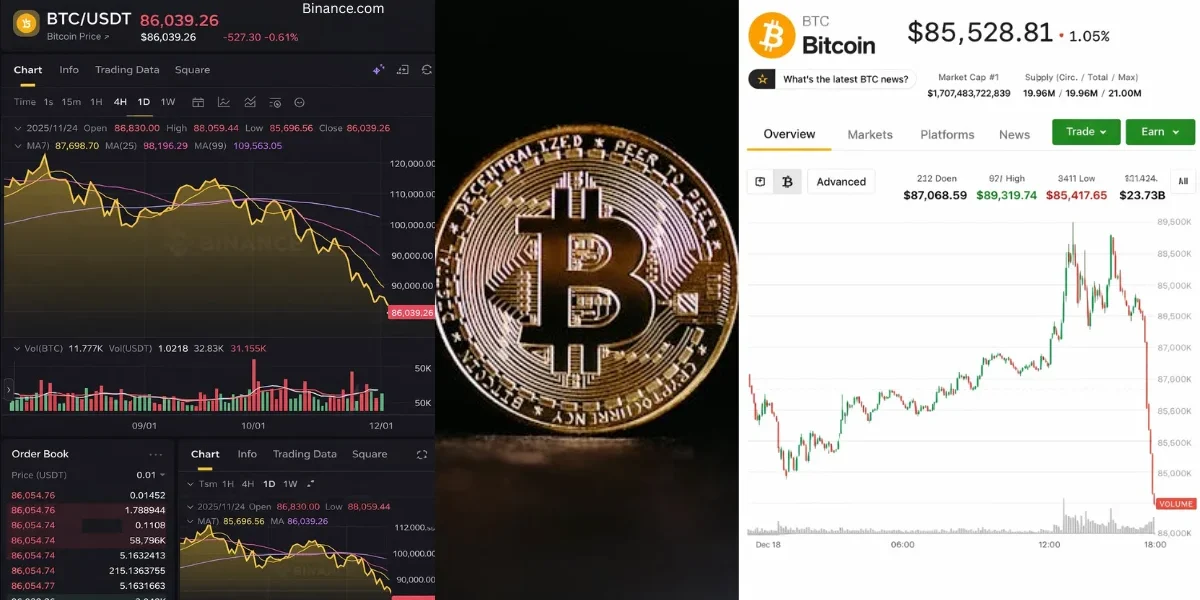
Bitcoin price news continues to dominate macro conversations as BTC trades near $68,000, consolidating after hitting its all-time high of $126,080 in October 2025. The current phase reflects a textbook post-ATH correction, not a structural breakdown.
According to live BTC market data, 24-hour trading volume sits near $33.8 billion with Bitcoin’s market dominance at 57.95%. Institutional positioning, ETF flows, and a tightening circulating supply are the three forces that will define BTC’s next directional move.
Stay ahead of BTC moves before they happen. Track real-time ETF flows, on-chain accumulation signals, and institutional positioning at FinanceCurves. Actionable analysis for traders and long-term investors — updated daily.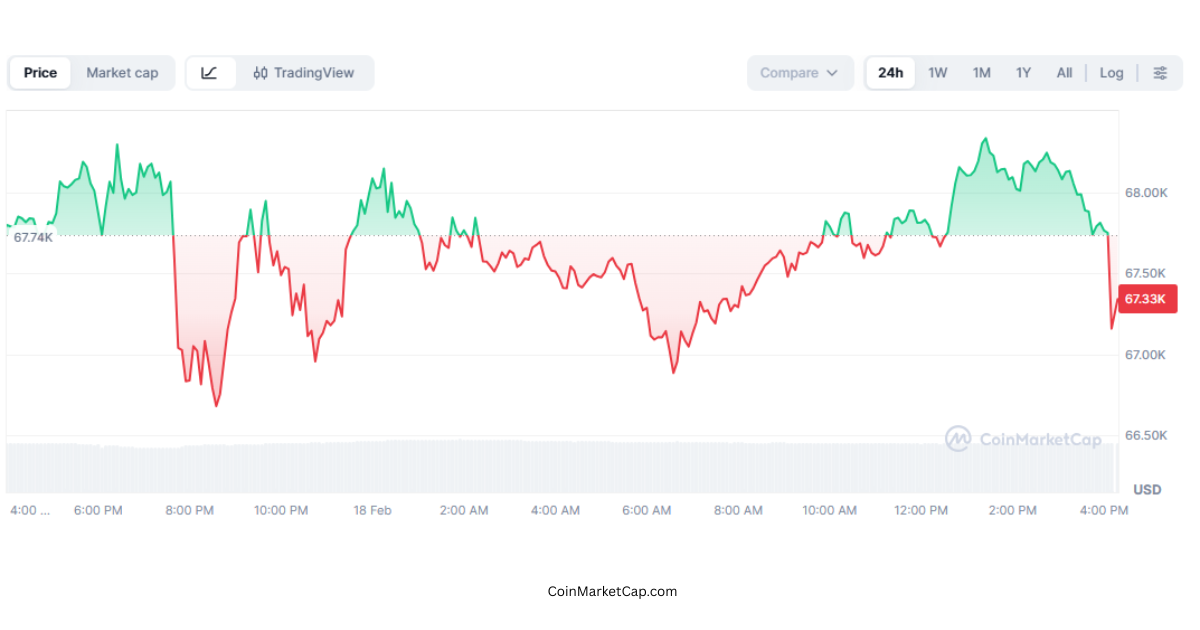
Post-ATH Market Movements and Trading Context
Bitcoin’s current price action sits within a well-defined post-cycle correction. Understanding where volume, ETF demand, and on-chain behavior stand right now is the starting point for any credible outlook.
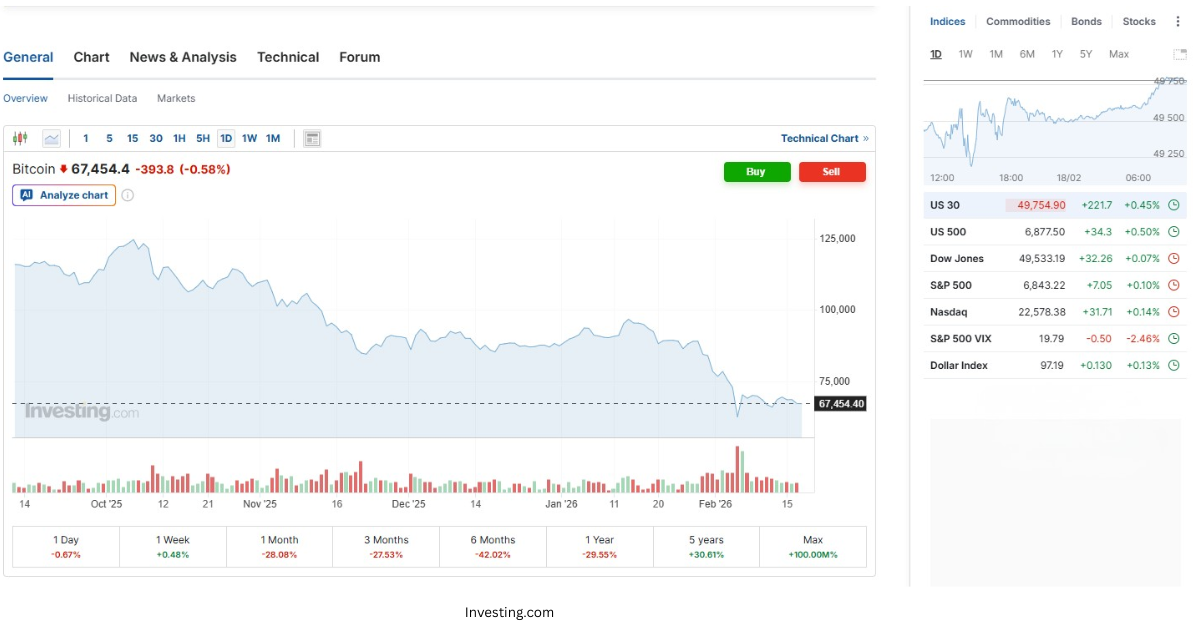
Bitcoin is currently trading at approximately $68,000, down roughly 46% from its cycle peak of $126,080. According to BTC’s 52-week range on Investing.com, the trading floor has held above $60,187, confirming that despite recent softness, BTC has maintained its macro uptrend structure. This kind of drawdown — deep enough to flush leverage, shallow enough to preserve institutional positioning — is consistent with every post-halving consolidation phase on record.
Key Market Snapshot (as of February 18, 2026)
| Metric | Value | Source |
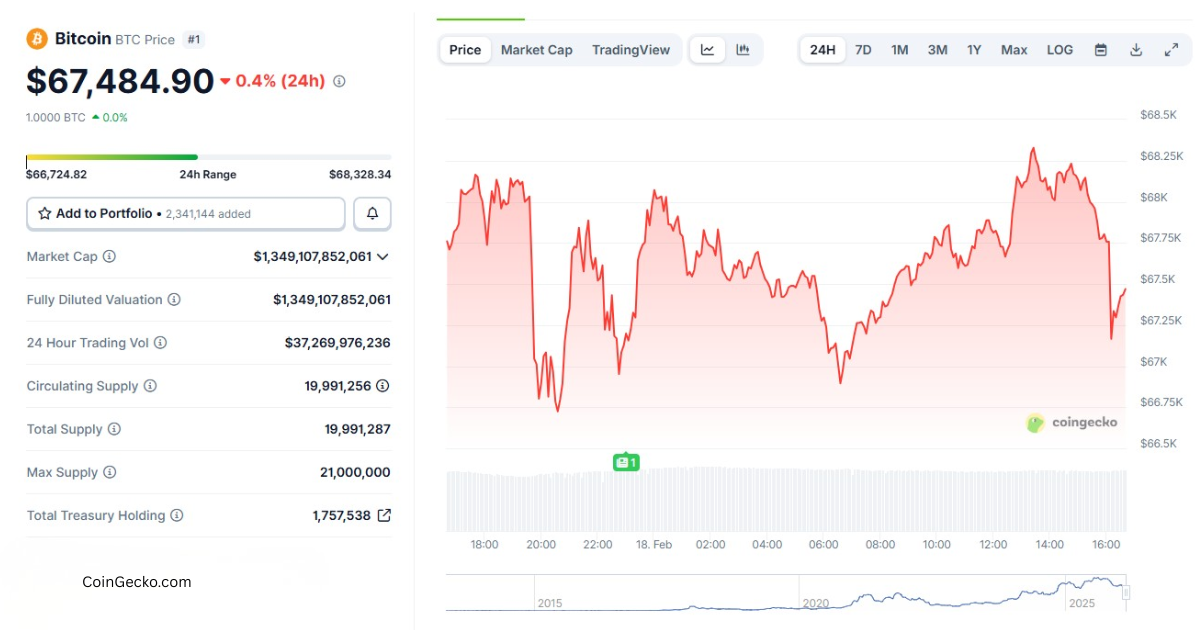
| BTC Price Today | ~$68,000 | CoinMarketCap |
| 24h Trading Volume | ~$33.8B | CoinMarketCap |
| Market Cap | ~$1.36 Trillion | CoinGecko |
| Circulating Supply | ~19.99 Million BTC | CoinGecko |
| Max Supply | 21 Million BTC | Bitcoin Protocol |
| Bitcoin Dominance | 57.95% | CoinMarketCap |
| All-Time High | $126,080 (Oct 2025) | TradingView |
The trading volume of bitcoin has moderated compared to Q4 2025 peak levels — a pattern consistent with post-ATH behavior across all prior cycles. Volume contractions during corrections are historically mean-reverting, not structural signals of demand destruction. For context, the cost of bitcoin has compressed roughly 46% from its October 2025 peak creating a materially different entry environment than the frothy conditions that preceded the ATH. The critical inflection point to watch: if volume re-accelerates above the $70,000–$72,000 zone, that confirms institutional re-accumulation rather than retail speculation. This can be monitored in real time on the BTCUSD price and volume dashboard.
On the ETF front, spot Bitcoin ETFs approved in the United States in early 2024 have permanently altered the demand structure. Pension allocators, RIAs, and hedge funds now access BTC through regulated vehicles without the operational complexity of managing private keys directly. This structural demand floor simply did not exist in prior cycles, and it is a primary reason post-ATH drawdowns have been comparatively contained this cycle.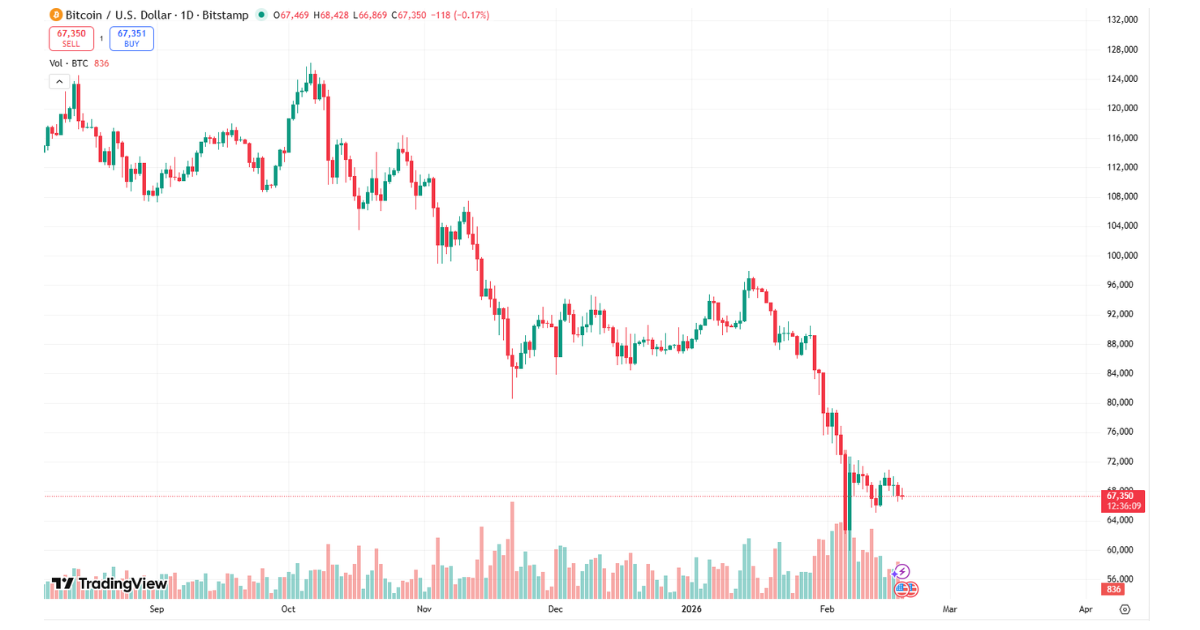
BTC Cycles, Halvings, and Supply Math
Bitcoin’s price history is not random. It follows a repeatable four-year cadence driven by supply issuance cuts, demand accumulation, and eventual price discovery. Understanding this cycle framework is essential context for any current price target discussion.
The BTC 2021 price cycled between approximately $29,000 at its July 2021 trough and $69,000 at the November 2021 ATH — both figures verifiable through CoinGecko’s historical market data. Bitcoin currently trades near that 2021 peak, but the underlying infrastructure is materially stronger: regulated ETFs, corporate treasury adoption, and a maturing derivatives market have all developed since then, changing the demand composition fundamentally.
The Supply Ceiling That Drives Everything
The supply of bitcoin tells a stark mathematical story. With roughly 19.99 million BTC in circulation out of a hard-capped 21 million, approximately 95% of all Bitcoin that will ever exist has already been mined. The April 2024 halving reduced the block reward from 6.25 BTC to 3.125 BTC cutting new daily issuance in half. Per CoinMarketCap’s Bitcoin halving schedule, this supply-demand imbalance historically takes 12–18 months to fully express in price, a pattern consistent across all four halving events since the network’s official launch in January 2009. Watch this detailed analysis on Bitcoin price trends and market outlook for deeper insights.
Each satoshi, the smallest unit of bitcoin at one 100 millionth of a full coin becomes structurally scarcer with every halving. Even at $200,000+ per BTC, micro-participation remains accessible. The amount of bitcoin remaining to mine is fewer than 1 million BTC, to be released across approximately 114 years making near-term supply pressure from new issuance statistically negligible.
Historical Cycle Multipliers (Trough to Peak)
| Cycle | Low | High | Multiplier |
| 2015–2017 | ~$150 | ~$19,800 | ~130x |
| 2018–2021 | ~$3,200 | ~$69,000 | ~22x |
| 2022–2025 | ~$15,500 | ~$126,080 | ~8x |
Diminishing multipliers are structurally expected as market cap scales — but even a 2x from current levels represents a significant absolute return for institutional and retail participants alike.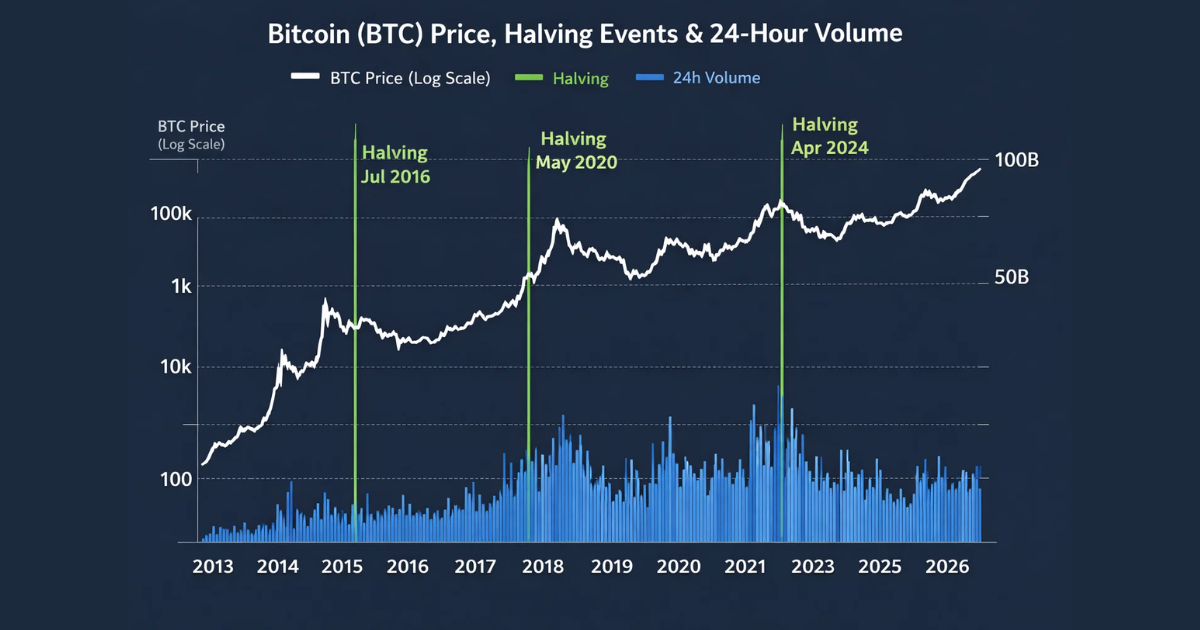
Bull Case: Institutional Flows and Price Targets
The bitcoin outlook for this cycle is not built on speculation — it rests on three structural shifts that are already live and measurable: shrinking supply, institutional demand formalization, and macro monetary loosening. Each pillar reinforces the bull case independently; together, they form a compounding argument for price appreciation over the next 12–18 months.
Institutional Adoption
Bernstein analysts have consistently ranked among the more credible institutional voices on BTC trajectory, forecasting sustained ETF inflow growth as major wealth management platforms open regulated digital asset access to retail brokerage clients. When platforms at the scale of Schwab — managing trillions across equities and thematic vehicles including its Schwab Utility ETF and broader sector fund lineup — integrate Bitcoin exposure, the addressable capital pool expands by orders of magnitude. The bitcoin btc market cap at $1.36T remains below Apple’s standalone market capitalization, suggesting price appreciation has a meaningful runway before saturation becomes a serious constraint.
The Peer-to-Peer Network Effect
Bitcoin’s founding vision — articulated in Satoshi Nakamoto’s 2008 whitepaper “Bitcoin: A Peer-to-Peer Electronic Cash System” — describes a peer electronic cash system operating without central authorities. That original architecture now extends via the Lightning Network, enabling fast, low-cost microtransactions on top of Bitcoin’s base settlement layer. The growing adoption of this peer-to-peer network for everyday commerce adds genuine utility beyond store-of-value — a use case expansion that broadens the addressable market significantly.
Macro Monetary Conditions
Global liquidity cycles, persistent inflation in developed economies, and expanding sovereign debt continue to favor hard-capped assets. A Federal Reserve pivot to rate cuts in 2026 — increasingly priced into futures markets — has historically preceded BTC outperformance by 6–12 months. That macro tailwind, combined with tightening supply post-halving, forms the backbone of the bull case.
Price Target Scenarios
| Scenario | BTC Price Target | Probability | Key Drivers |
| Base Case | $85,000–$95,000 | 45% | ETF inflows resume, macro stabilizes |
| Bull Case | $150,000 | 30% | Supply squeeze, institutional re-accumulation |
| Extreme Bull | $200,000+ | 10% | Sovereign adoption, full macro tailwinds |
| Bear / Stagnation | $50,000–$60,000 | 15% | Regulatory shock, global risk-off event |
Probabilities represent analyst estimates derived from on-chain data and macro modeling, not investment guarantees.
Bear Case and Key Risk Factors
No credible market analysis is complete without equal weight on downside risks. Several material threats to the bull case remain active and warrant continuous monitoring.
Regulatory Headwinds
The SEC’s digital asset enforcement and rulemaking activity continues to introduce headline risk. International regulatory divergence particularly EU MiCA enforcement timelines — adds further uncertainty.
Leverage and Derivatives Risk
Perpetual futures allow leveraged BTC exposure across multiple exchanges. During sharp moves, cascading liquidations amplify drawdowns significantly beyond what on-chain fundamentals justify. Monitoring open interest relative to spot volume, both trackable on TradingView’s BTC chart, helps distinguish organic price moves from leverage-amplified volatility.
Liquidity Constraints
Despite BTC’s depth as a market, correlation to equities during true global risk-off events is well-documented. March 2020 saw a 50%+ drop in 48 hours during a liquidity crisis that had nothing to do with Bitcoin fundamentals. Systemic risk remains an external variable that on-chain data alone cannot predict.
Private Key Security
For direct holders, the permanent and irreversible loss of a private key means permanent loss of funds — a risk with no equivalent in traditional financial markets. While hardware wallet technology and institutional custody infrastructure have matured considerably; this operational risk remains non-trivial for self-custody participants.
On-Chain Indicators Worth Watching
On-chain data provides a view beneath the price surface — revealing what long-term holders, miners, and exchanges are actually doing with their BTC, independent of short-term sentiment.
Bitcoin’s transaction fees are a real-time proxy for block space demand. Current fee levels remain moderate following the Ordinals-driven spike of 2023–2024, suggesting reduced speculative activity without indicating network abandonment. Fee normalization at this stage of the cycle is structurally consistent with accumulation phases.
According to Glassnode’s long-term holder metrics, wallets holding BTC for 155+ days continue to accumulate at current prices. This cohort — historically the most reliable leading indicator of cycle bottoms — has not shown meaningful distribution. Short-term holders (STH) show some capitulation pressure, consistent with the Adjusted Spent Output Profit Ratio (aSOPR) entering bear-adjacent territory. That divergence — LTHs accumulating while STHs capitulate — is classically associated with base-building before the next leg higher.
Miner outflow data from Glassnode remains subdued post-halving, suggesting miners are holding production rather than selling into weakness. Accelerating miner outflows would signal margin stress among less efficient operations — a risk to monitor but not currently triggered.
Bitcoin held on centralized exchanges continues to trend lower over multi-year timeframes — reflecting self-custody adoption and institutional cold storage growth. Reduced exchange supply means less immediately sellable BTC on order books, a structural tailwind that CoinGecko’s exchange flow tracking illustrates clearly.
Strategic Positioning for Investors and Traders
Conviction without structure is speculation. The following framework applies whether the time horizon is days or years.
Position Sizing and Portfolio Allocation
Institutional risk frameworks typically cap crypto exposure at 1%–5% of total portfolio value. At BTC’s current annualized volatility — running significantly above traditional equities — oversizing relative to overall portfolio beta creates concentration risk that return expectations alone cannot justify. Capital allocation discipline is more important in a post-ATH correction phase than at any other point in the cycle.
Short-Term vs. Long-Term Approach
The 24-hour trading volume of bitcoin and intraday price action are useful inputs for tactical entry timing, but cycle-level allocation decisions should be anchored to on-chain metrics and macro positioning. Research from Glassnode consistently shows that systematic dollar-cost averagers outperform cycle-timing strategies across every prior BTC cycle — a finding worth internalizing before attempting to buy bitcoin at perceived lows.
Hedging and Downside Management
Covered put structures, options collars, or partial conversions to stablecoins can meaningfully reduce drawdown exposure during uncertain macro periods without requiring full position exits. For large holders facing significant capital gains tax consequences, these instruments offer a path to risk reduction that outright selling does not.
Catalyst Timing
Bitcoin historically sees its sharpest 24-hour price moves following macro catalysts, FOMC decisions, ETF flow data releases, and significant on-chain accumulation signals. Traders with defined risk parameters around these events consistently outperform those reacting after the move has occurred.
Probabilities vs. Predictions: What the Data Actually Says
Bitcoin’s post-ATH correction near $68,000 is consistent with historical post-halving cycles, signaling consolidation rather than a structural decline. Institutional adoption, spot ETFs, and Lightning Network growth provide durable support, while a nearly fixed circulating supply underlines BTC’s deflationary appeal. Key metrics to monitor include ETF inflows, long-term holder accumulation, exchange supply trends, transaction fees, and macro or regulatory developments. Probabilistic scenarios suggest a base case of $85,000–$95,000, a bull case of $150,000, and a downside of $50,000–$60,000. Historical patterns show Bitcoin recovering from deep drawdowns, highlighting the importance of patience, disciplined strategy, and attention to structural market signals. For daily BTC insights and strategy updates, visit FinanceCurves.
Educational Disclaimer: The content above is for educational and informational purposes only and does not constitute financial advice. Cryptocurrency markets are highly volatile and carry significant risk of loss. Past performance is not indicative of future results. Always conduct independent due diligence and consult a licensed financial advisor before making investment decisions. Price targets and probability estimates represent analyst opinion based on available data as of the publication date — not guarantees of future performance.
FAQ
What is Bitcoin price today?
Bitcoin is trading near $68,000 with a 24-hour volume of about $33.8 billion and a market cap around $1.36 trillion.
What is bitcoinpricetoday and how do I track it?
Bitcoinpricetoday shows the current BTC price, and reliable live data comes from CoinMarketCap or CoinGecko.
Can BTC reach $150,000?
$150,000 is a plausible bull-case target if ETF inflows, macro easing, and long-term holder accumulation continue.
What factors most affect Bitcoin price movement?
Price moves are driven by ETF flows, macro liquidity, halving supply reductions, on-chain holder behavior, and regulations.
How does circulating supply affect BTC value?
With ~19.99M BTC of 21M mined, limited supply makes BTC increasingly scarce, supporting upward price pressure.
Who is Satoshi Nakamoto and why does it matter?
Satoshi Nakamoto created Bitcoin in 2009; their anonymity ensures no single entity controls the network.
What was the BTC price in 2021?
BTC ranged from ~$28,000–$29,000 to $69,000 in 2021, compared to ~$68,000 today with stronger infrastructure.
How do I buy Bitcoin safely?
Use regulated exchanges with 2FA, consider hardware wallets, or access BTC via spot ETFs in brokerage accounts.
Disclaimer
The information provided on this website is for informational and educational purposes only. While we strive to ensure accuracy and keep our content up to date, FinanceCurves makes no guarantees regarding the completeness, reliability, or accuracy of any information published.
Nothing on this site constitutes financial, tax, legal, or investment advice. Readers should consult a qualified financial advisor, certified tax professional, or licensed attorney before making any financial decisions. Your individual situation may vary, and decisions based on information from this website are made at your own risk.
FinanceCurves may reference government agencies, financial institutions, or official programs for informational purposes only. We are not affiliated with, endorsed by, or connected to any government entity, including the IRS or any federal or state agency.
Some content may contain links to third-party websites for additional context or resources. We are not responsible for the content, accuracy, or practices of any external sites.
By using this website, you agree to this disclaimer and our terms of use.

Charles Cooper is a Senior Cryptocurrency Analyst at FinanceCurves.com with over 10 years of experience in financial markets. He specializes in Bitcoin, digital assets, blockchain technology, and on-chain analysis, providing research-driven insights grounded in market data, macroeconomic trends, and risk management principles. Charles helps readers navigate volatility, adoption trends, and evolving regulatory and market dynamics in the cryptocurrency and broader financial landscape.